European DataDog Alternatives
A curated collection of the 8 best European alternatives to DataDog.
The best European alternative to DataDog is BetterStack Telemetry. If that doesn't suit you, we've compiled a ranked list of other European DataDog alternatives to help you find a suitable replacement. Other interesting alternatives to DataDog are: AppSignal, Bugfender, Openstatus, and Bugsink.
DataDog alternatives are mainly Developer Tools but may also be Monitoring & Observability Services. Browse these if you want a narrower list of alternatives or looking for a specific functionality of DataDog.
This list contains services from companies headquartered, including any parent companies, in the European Union (EU), the European Economic Area (EEA), the European Free Trade Association (EFTA), the United Kingdom, an EU candidate country, or a European microstate. Russia and Belarus are excluded. You can read more about the listing conditions here.

Written by Piotr Kulpinski

DataDog


Visualize your entire stack, aggregate all your logs into structured data, and query everything like a single database with SQL.

Gain comprehensive visibility into your entire technology stack with this powerful observability platform. It aggregates all your logs from servers, applications, containers, and cloud providers into structured, queryable data. Search billions of log lines per second using familiar SQL syntax, eliminating the need for rehydration or cold storage. Customize data retention per source and query everything you need, anytime. Plaintext logs are automatically transformed into structured JSON, simplifying context filtering with single-click actions.
Key features include:
- Ultra-fast log search: Query up to 1 billion log lines per second.
- Collaborative dashboards: Work together with teammates in real-time to investigate issues.
- SQL-based querying: No need to learn proprietary query languages.
- Anomaly detection & alerting: Get notified of irregularities before they become incidents.
- Integrated incident management: Includes on-call scheduling, escalation policies, and status pages.
- Scalability and compliance: Reliably handles terabytes of data and meets SOC 2 and GDPR standards.
This solution offers significant cost savings by leveraging efficient data processing and storage.


Gain deep insights into your Ruby, Elixir, Node.js & Python apps with error tracking, performance monitoring, host metrics, and custom dashboards. Fix issues fast.

AppSignal provides comprehensive Application Performance Monitoring (APM) designed for Ruby, Elixir, Node.js, Python, and JavaScript applications. It helps developers move from alert to fix swiftly, often before customers notice issues. Installation is straightforward, and the platform is powerful by design.
Key monitoring features include:
- Error Tracking: Detailed error reports, real-time alerts, and integration with issue trackers.
- Performance Monitoring: Pinpoint slow actions, analyze duration breakdowns, and identify slow queries.
- Host Monitoring: Keep an eye on server metrics like CPU usage, disk I/O, load average, and memory.
- Anomaly Detection: Set triggers for anomalies on any metric with pre-configured key alerts.
- Uptime Monitoring: Get real-time alerts if your application goes down, with global monitoring points.
- Metric Dashboards: Visualize data with auto-generated and custom dashboards.
- Log Management: Centralize, search, and filter logs, linking them to errors and performance issues.
- Check-ins: Monitor background jobs and scheduled processes effectively.
AppSignal is built with a lightweight agent in Rust, ensuring stability and minimal overhead. It is GDPR compliant and offers dedicated dev-to-dev support.


Access full application logs, not just crashes, to resolve bugs effectively and enhance customer support. Get real-time error alerts and user feedback.

Gain comprehensive insights from every user device globally to proactively identify and resolve issues before they impact users. This service offers remote logging to capture logs from mobile and frontend applications, even when they aren't crashing. This provides a 24/7 logging capability with an easy-to-use dashboard and a device-centric approach to unify customer logs.
Key capabilities include:
- Error Monitoring: Receive real-time alerts for errors, crashes, and exceptions, complete with stack traces, error context (logs and user actions), and device information for precise diagnostics.
- User Feedback: Collect feedback directly from your app users, understanding their issues with contextual data. Integrate a drop-in feedback form or customize it to your needs.
- Mobile-First SDK: Built to be minimally intrusive, battery-efficient, compact, and supportive of offline mode, ensuring it doesn't affect your app's user experience.
- Device Centric Approach: Easily drill down to the logs of a single device or user, avoiding sifting through thousands of irrelevant logs.
- Security by Design: Your customer's data is protected with ISO 27001 certification, GDPR compliance, and robust encryption.
This tool helps you fix client-side bugs faster at any stage of development, leading to better applications and improved customer support by providing full logs, not just crash reports.


Open-source uptime monitoring with customizable status pages. Monitor from 28 global regions, get instant alerts, and keep users informed during incidents.
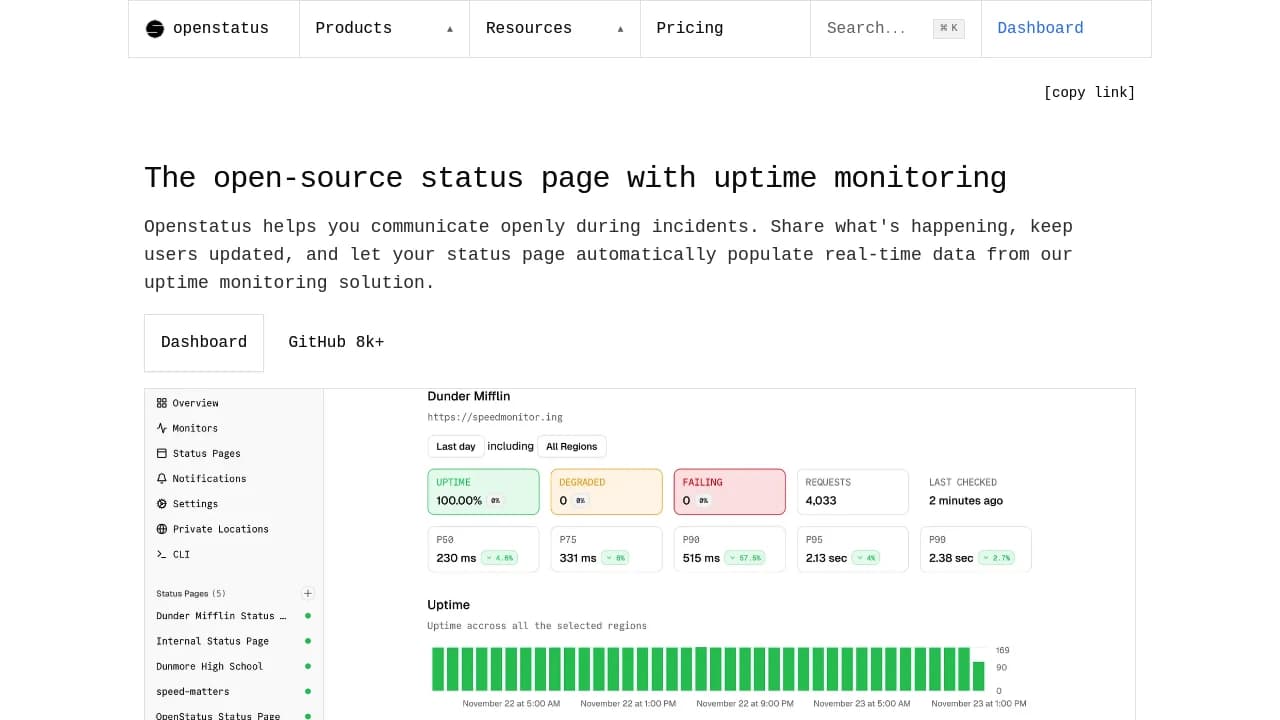
OpenStatus combines uptime monitoring with transparent status pages to help you communicate effectively during incidents. Monitor your services from 28 regions worldwide across multiple cloud providers and automatically populate your status page with real-time data.
Key Features:
- Global Monitoring: Track uptime from 28 regions across Fly.io, Koyeb, and Railway
- API Monitoring: Validate responses with assertions, thresholds, and body validation
- Customizable Status Pages: Use themes, custom domains, and branding options
- Monitoring as Code: Configure monitors using YAML with GitHub Actions integration
- Private Locations: Deploy 8.5MB Docker image for internal monitoring
- Multiple Notification Channels: Email, Slack, Discord, RSS/Atom, and SSH subscriptions
Benefits:
- Proactive Communication: Notify users before they discover issues themselves
- Transparency: Build trust by openly sharing service status and incident updates
- Fast Response: Get immediate alerts when services go down
- Professional Appearance: Password-protected pages for internal teams or public transparency
The platform offers monitoring as code capabilities, allowing you to define monitors in YAML configuration files and integrate with your existing CI/CD workflows. With OpenTelemetry export support and comprehensive API monitoring including status codes, headers, and response validation, OpenStatus provides enterprise-grade monitoring with open-source flexibility.

Self-hosted error tracking solution with instant setup, Sentry SDK compatibility, and scalability to millions of events daily. Full data control on your servers.

Bugsink offers a powerful self-hosted error tracking solution that puts you in complete control of your data while delivering enterprise-grade performance. With a 30-second installation process using Docker, you can have your error tracking system up and running almost instantly.
The platform is fully compatible with Sentry's open source SDKs, making migration seamless across all popular programming languages. Simply add a few lines of code to your application and start capturing detailed error reports with cause, context, and stacktrace all in one place.
Built for scale, Bugsink can handle millions of events per day on cost-effective hardware, ensuring your error tracking never fails when you need it most. Unlike hosted solutions with per-event billing, Bugsink runs on your own servers with unlimited volume and can save up to 80% at scale.
Key benefits include:
- Complete data ownership - runs on your servers
- No per-event billing - unlimited error tracking
- Sentry SDK compatibility - easy migration and integration
- Lightweight architecture - less complex than alternatives
- ARM compatibility - flexible deployment options
- Local variable access - enhanced debugging capabilities
Trusted by 300+ teams weekly, Bugsink has proven its reliability in production environments processing millions of events while maintaining cost efficiency and performance.


Full-stack monitoring for Laravel, PHP, and JavaScript that combines error tracking, performance monitoring, and logging in one place.

Flare is an error tracking and performance monitoring platform built specifically for Laravel and PHP applications, with support for JavaScript on the front end. It's designed for teams that want visibility into what's breaking and what's slowing down without the overhead of generic monitoring tools.
The core problem Flare solves is fragmentation. Instead of juggling separate tools for exceptions, slow requests, and logs, everything lives in one place. You see errors as they happen, track down performance bottlenecks, and search through logs in real-time. The platform catches what matters: unhandled exceptions, slow database queries, backed-up job queues, and client-side JavaScript errors.
What sets Flare apart is its depth of Laravel and PHP integration. It understands Laravel's structure and gives you context that generic monitoring tools miss, exceptions with full stack traces, queue and job tracking, and Livewire component errors. On the front end, it handles React, Vue, and Svelte errors alongside your back-end issues. You get the full picture without having to stitch tools together.
Key capabilities include:
- Error tracking that captures exceptions with full context and stack traces
- Performance monitoring to spot slow requests, database queries, and job delays
- Real-time logging with instant search and filters to find the signal in the noise
- AI-powered investigation to go from error to root cause without leaving the platform
- Workflow integration with GitHub, GitLab, Jira, and Linear so you can turn errors into tickets and fixes
- CLI and MCP support for fixing errors directly from your terminal
Flare is built and hosted in the EU, with data handled under GDPR and European data protection standards. It's made by Spatie, a Belgian company known for Laravel packages and tools.


Comprehensive uptime monitoring, incident management, status pages, and privacy-first analytics in one European-hosted platform. Trusted by 700+ companies.

Phare combines essential website monitoring tools into one comprehensive platform designed for businesses that value reliability and transparency. This European-based solution offers 24/7 uptime monitoring with instant alerts, ensuring you're the first to know when issues arise.
The platform features intelligent incident management that facilitates team collaboration during critical situations, helping minimize downtime through coordinated response efforts. Customizable status pages keep users informed during maintenance periods and outages, maintaining transparency with your audience.
Key advantages include:
- Privacy-first analytics with no cookies or tracking, providing traffic insights for data-driven decisions
- Unlimited team members across unlimited projects with straightforward billing
- Extensive integrations with popular tools for seamless workflow integration
- European hosting across Germany, Slovenia, Netherlands, and France - no big tech dependencies
- Carbon-neutral operations running on 100% renewable energy with 2% revenue donated to carbon removal
Trusted by 700+ startups, agencies, and SMBs, Phare maintains an impressive 4.8-star average rating and earned Product of the Day recognition. The platform offers free access to all features with no credit card required, making it accessible for teams of any size.
With its clean interface, robust API documentation, and commitment to sustainability, Phare represents a thoughtful alternative to traditional monitoring solutions.


Privacy-focused error tracking alternative to Sentry. Pay once, host yourself, track unlimited errors across all apps. No subscriptions, quotas, or data sharing.

Telebugs offers a refreshing approach to error tracking by eliminating recurring subscription costs and keeping your data completely under your control. This self-hosted Sentry alternative lets you pay once ($499) and track errors across your entire company forever.
Key advantages over traditional SaaS solutions:
- One-time payment - No monthly fees that grow with your success
- Complete data privacy - Your error data never leaves your infrastructure
- Unlimited error tracking - No quotas or event limits
- Simple installation - Single command deployment with automatic SSL setup
- Wide platform support - Compatible with React, Vue, Angular, Go, Swift, Django, .NET, and more
Perfect for:
- Regulated industries requiring GDPR, CCPA, or PECR compliance
- Bootstrapped companies wanting to eliminate growing monthly expenses
- Development teams needing staging environment error tracking
- Agencies setting up long-term solutions for clients
The lightweight Docker container runs efficiently on minimal hardware (1GB RAM, 1 CPU) and can handle millions of errors daily. Automatic updates within major versions keep your installation current, while email support helps with setup questions.
Unlike bloated alternatives, Telebugs focuses purely on error tracking without unnecessary features. It integrates seamlessly with existing Sentry SDKs for easy migration, supports Progressive Web App functionality for mobile access, and works perfectly in air-gapped environments.
Technical requirements are minimal: a domain name, basic server access, and 10 minutes for setup. The included installation guide and video tutorial make deployment straightforward for any developer.
DataDog
Find alternatives to

 Oh Dear – EU-hosted, GDPR-compliant uptime monitoring